CLIENT
OVTLYR
PROJECT DATE
May 2024
SCOPE OF WORK
ROLE
UI/UX Designer
OVTLYR – The Investor Sentiment Engine
OVTLYR isn’t just another analytics platform—it’s a pioneering tool that transforms investor sentiment into actionable market insights. Merging the designer’s deep investment knowledge with Figma’s powerful capabilities, OVTLYR bridges the gap between what investors think and how they act in real time.
OVTLYR
Overview
❌ The Problem
Investors often struggle to decipher market sentiment, as traditional analytical tools rely heavily on historical data and standard technical indicators that fail to capture the dynamic nuances of human behavior. This gap between what investors think and how they act leads to several critical challenges.
✅ The Solution
OVTLYR addresses these challenges head-on by transforming qualitative behavioral data into a comprehensive, data-driven investment tool. Here’s how OVTLYR solves the problem:
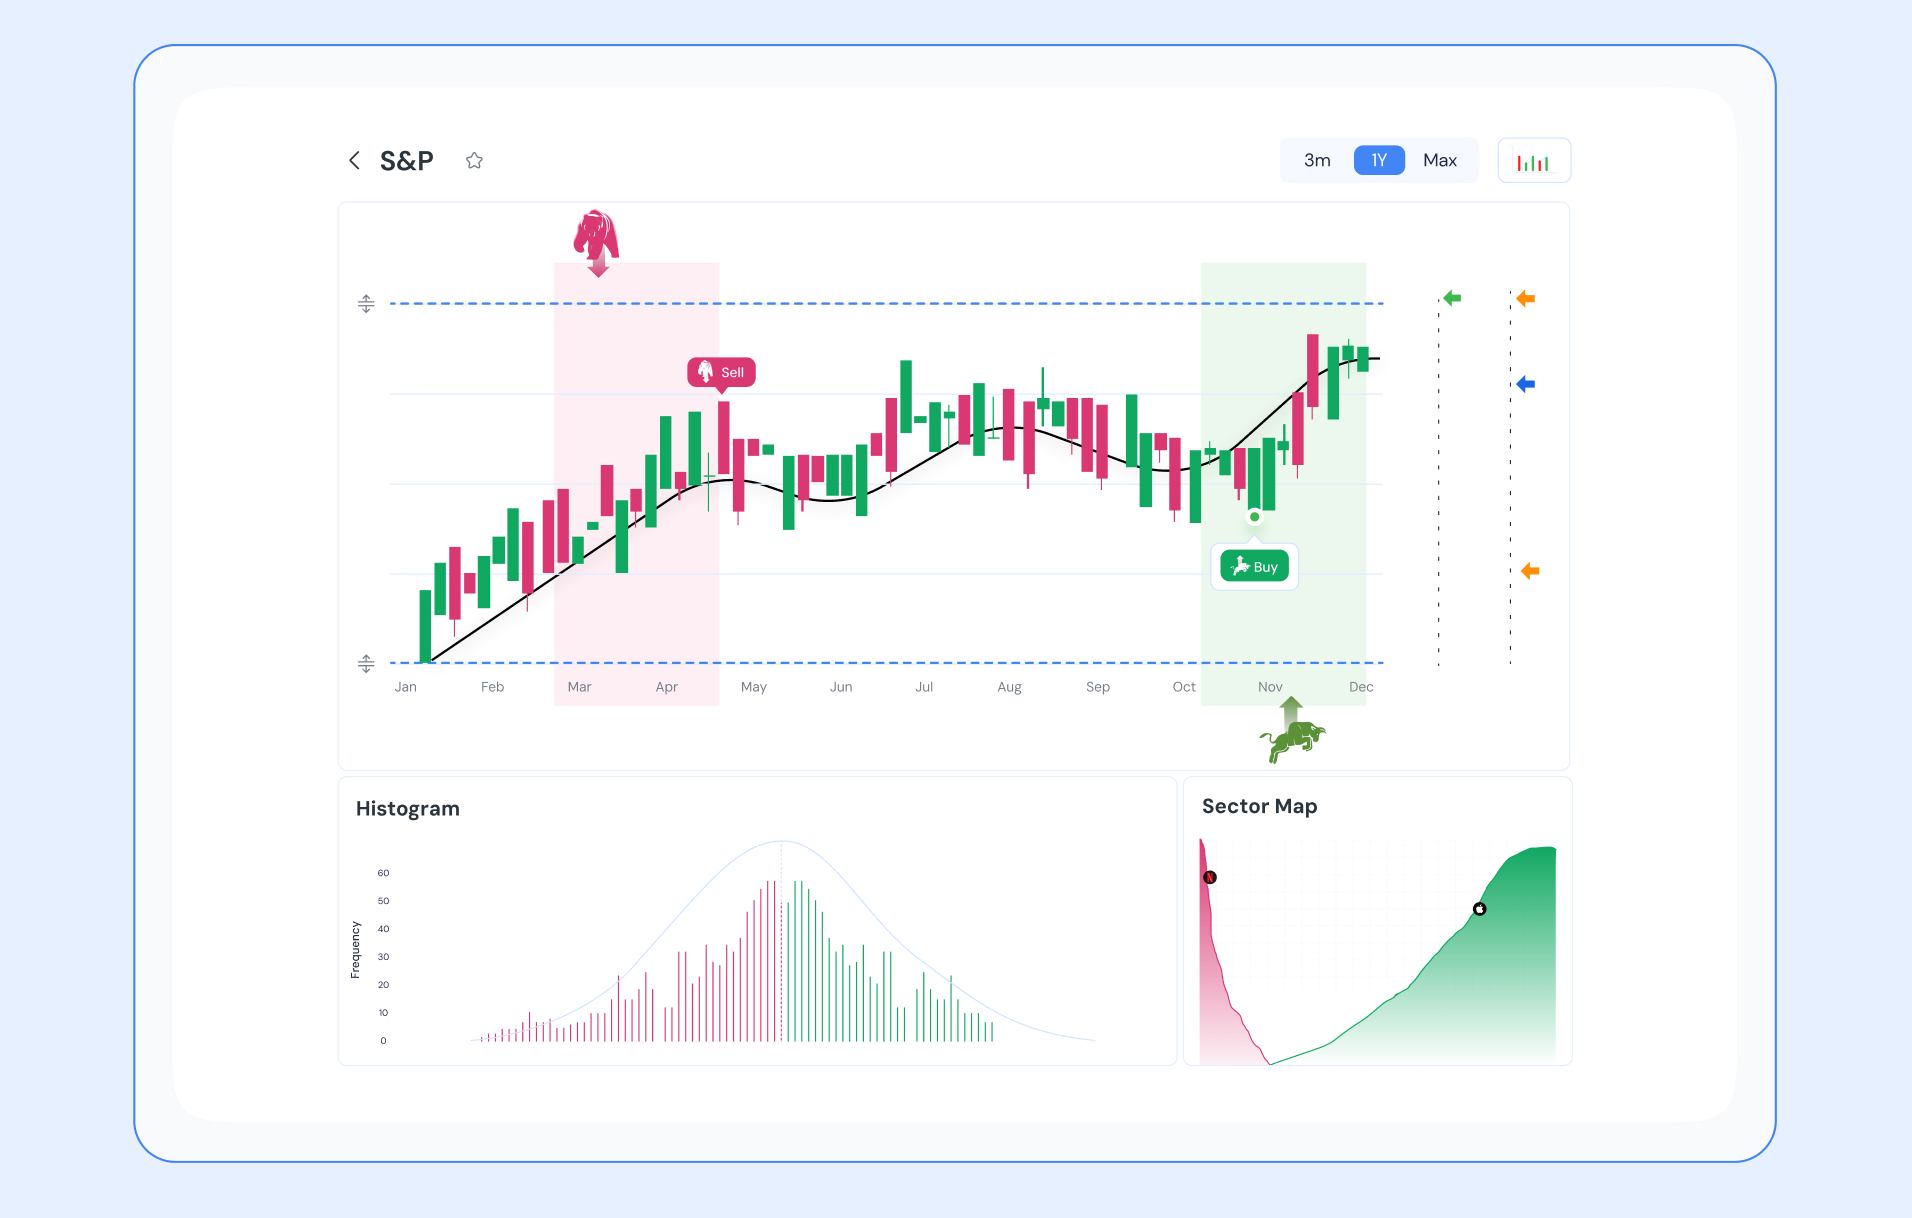
- Dynamic Buy & Sell Signals:
By adapting to changing market conditions, these signals provide timely, actionable insights. In extended trends, the signals remain active longer, while in volatile markets, they adjust rapidly to short-lived conditions, ensuring that investors receive accurate, real-time alerts. - Price Trajectory Oscillator:
This predictive tool leverages investor fear and greed data along with proprietary directional volatility measurements to forecast near-to-intermediate price trends. It equips investors with a forward-looking view, enabling proactive decision-making. - Heatmap Chart:
Utilizing a color-coded visual representation, the heatmap highlights daily fluctuations in investor sentiment. The clear visualization of “fear” (red) and “greed” (green) provides an immediate snapshot of market psychology. - Down-Cycle & Recovery Indicators:
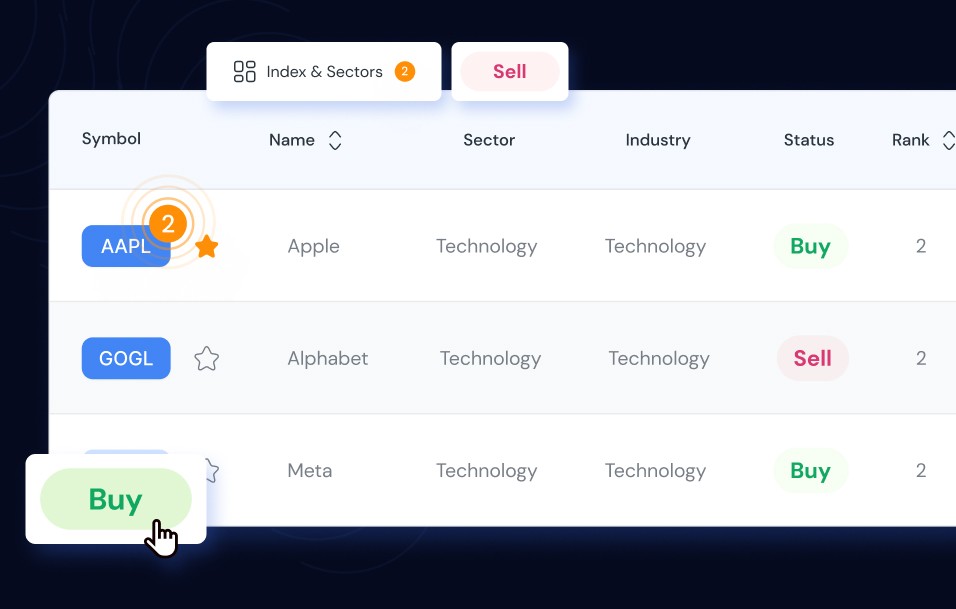
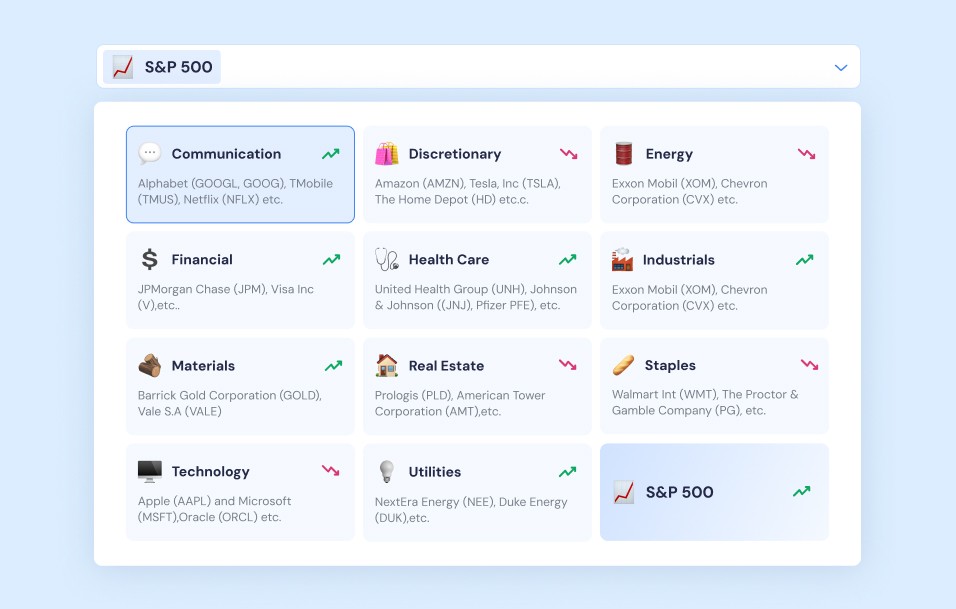
These indicators act as early warning systems, alerting investors to potential market downturns and signaling opportune moments for reentry during recovery phases, thus minimizing losses and maximizing gains. - Constituent Map:
Offering a detailed, daily ranking of sentiment scores across companies within a sector or index, this tool enables investors to quickly assess the overall market mood and make sector-based strategic decisions. - Directional Volatility Histogram:
By isolating downside risk from overall volatility, the histogram presents the “real risk” of owning a stock—focusing on potential monetary loss rather than just price fluctuations. It thereby clarifies risk exposure for investors.
Design Process
1
Research
Existing research, data analysis, Stakeholders interview, competitor analysis, user testing
2
Wireframing
Workshop, look for Ideas.
3
Prototyping
Design iteration, design explanations, testing
4
Final Design
Main design, solution for Web, IOS, ANDROID.
Wireframing
- Initial Sketches & Layouts in Figma:
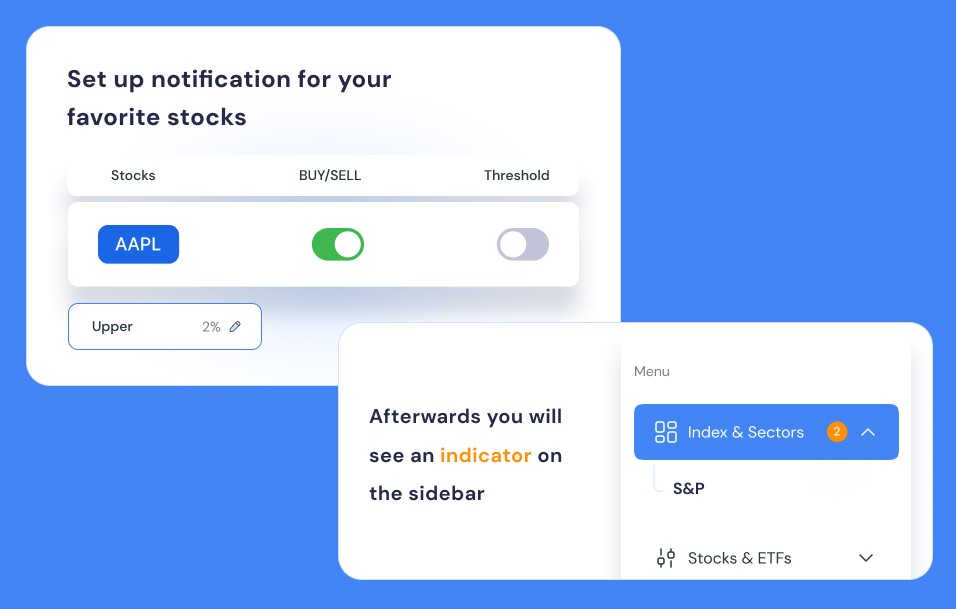
Created detailed wireframes that outlined the overall structure—featuring dashboards, interactive charts, and real-time data panels. The focus was on clear, logical user flows that would make complex financial data immediately understandable. - User Journey Focus:
Designed pathways that guide investors through a story of data, from initial market sentiment readings to actionable investment insights, ensuring the interface remained both powerful and accessible.
Prototyping
- Interactive Figma Prototypes: Developed clickable prototypes to simulate the full user experience. This allowed for real-time testing of interactive elements, from dynamic heatmaps to the responsive Buy and Sell signals.
- Iterative Refinement: Conducted extensive usability testing with seasoned investors and market experts. Feedback was used to fine-tune visualizations, transitions, and micro-interactions, ensuring that every feature was both functionally robust and visually engaging.
Final Deliverables
- Aesthetic & Functional Integration:
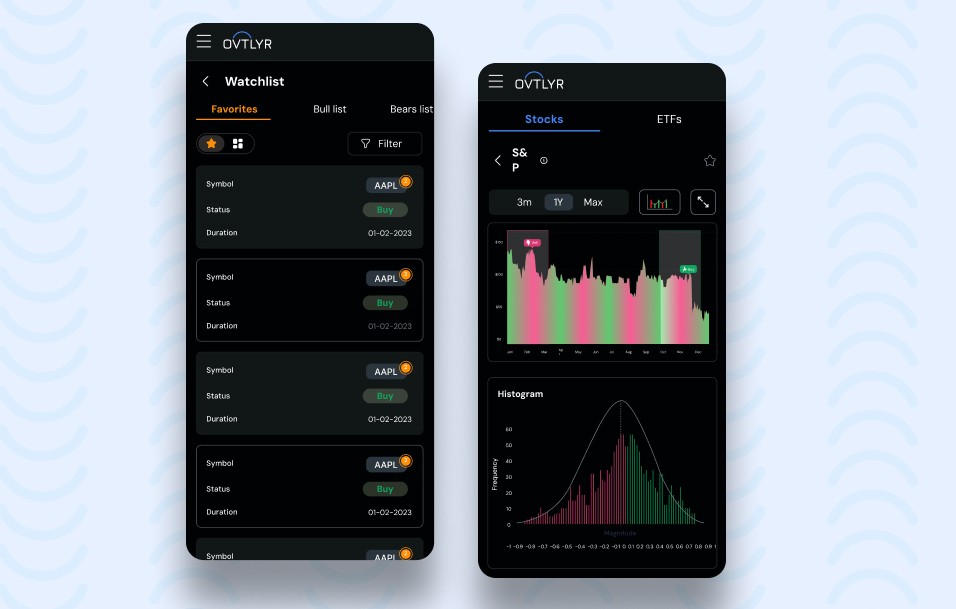
The final design marries a modern, professional aesthetic with dynamic, data-driven elements. The interface uses a refined color palette—accentuating critical moments of market fear (red) and greed (green)—and incorporates subtle animations to signal real-time data changes. - Feature-Rich Visualizations:
Each core feature, from the Price Trajectory Oscillator to the Directional Volatility Histogram, is presented clearly. Detailed infographics and responsive charts ensure investors can quickly digest complex trends and make informed decisions. - Responsive & Adaptive Design:
Ensured that the platform is fully responsive, delivering a seamless experience across desktop, tablet, and mobile devices so investors can access critical data anytime, anywhere.
This portfolio structure not only details the technical and design aspects of OVTLYR but also tells the story of how deep market insight and design excellence come together to empower investors.
Outcomes and Impact
Actionable Insights:
OVTLYR successfully transforms raw market data into actionable insights, enabling investors to anticipate market movements with clarity and confidence.
OVTLYR successfully transforms raw market data into actionable insights, enabling investors to anticipate market movements with clarity and confidence.
Enhanced Decision-Making:
User feedback highlights the platform’s ability to simplify complex behavioral analytics into clear, understandable signals that directly impact investment strategies.
User feedback highlights the platform’s ability to simplify complex behavioral analytics into clear, understandable signals that directly impact investment strategies.
Future Outlook:
Ongoing enhancements aim to incorporate additional algorithms and refine predictive models further. This continuous evolution is set to provide even deeper insights, reinforcing OVTLYR’s status as an indispensable tool in modern investing.
Ongoing enhancements aim to incorporate additional algorithms and refine predictive models further. This continuous evolution is set to provide even deeper insights, reinforcing OVTLYR’s status as an indispensable tool in modern investing.